📊 Normal Distribution
It is one of the most important distributions in statistics because many natural and social phenomena approximately follow this pattern.
Examples include height, weight, blood pressure, IQ scores, measurement errors, and many variables used in AI models.
🔔 Shape and Key Characteristics
- Bell-shaped curve
- Perfectly symmetric about the mean
- Mean = Median = Mode
- Tails approach the horizontal axis but never touch it
📐 Parameters of the Normal Distribution
1️⃣ Mean (μ)
The mean determines the center of the distribution.
- If μ shifts right → curve shifts right
- If μ shifts left → curve shifts left
2️⃣ Standard Deviation (σ)
The standard deviation controls the spread of the distribution.
- Large σ → Wider and flatter curve
- Small σ → Narrower and taller curve
🧮 Example — Population Heights
Suppose heights of adults in a population are normally distributed with:
- Mean height μ = 175 cm
- Standard deviation σ = 10 cm
This means:
- Most people have heights close to 175 cm
- Fewer people are extremely short or extremely tall
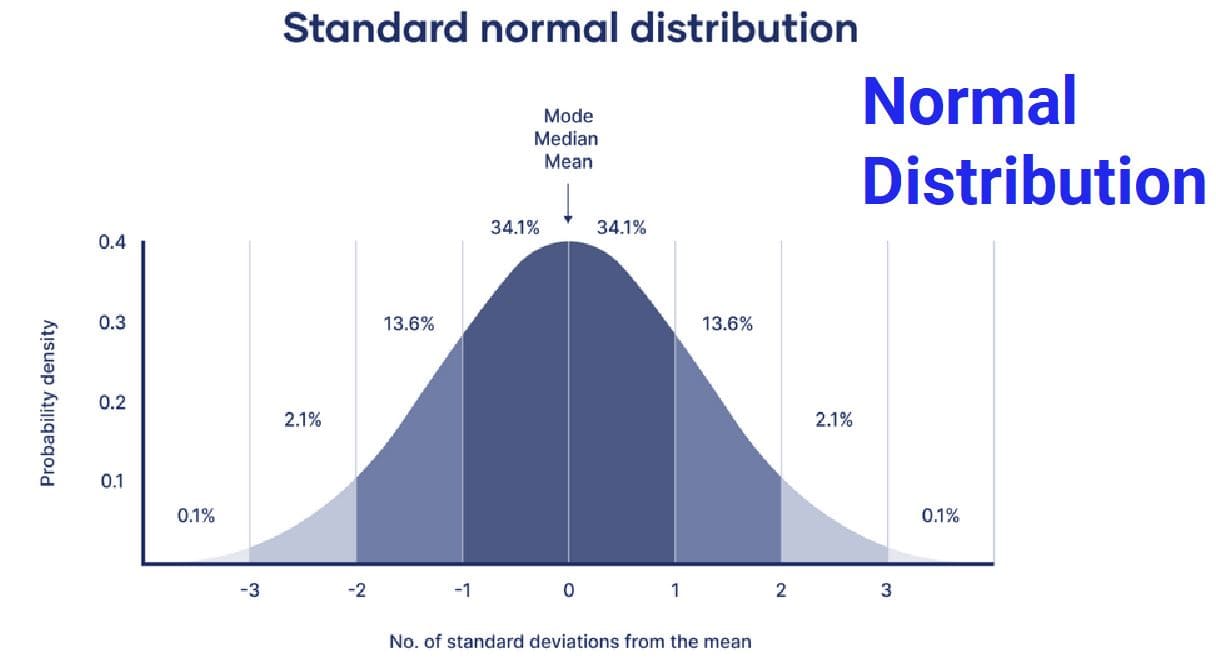
📏 Empirical Rule (68–95–99.7 Rule)
The normal distribution has a very useful property:
| Distance from Mean | Percentage of Observations |
|---|---|
| Within ±1σ | ≈ 68% |
| Within ±2σ | ≈ 95% |
| Within ±3σ | ≈ 99.7% |
Applying to Heights Example
- μ ± 1σ → 175 ± 10 → 165 to 185 cm → 68% of people
- μ ± 2σ → 175 ± 20 → 155 to 195 cm → 95% of people
- μ ± 3σ → 175 ± 30 → 145 to 205 cm → 99.7% of people
🎯 Using Normal Distribution to Find Probabilities
The area under the curve represents probability.
Total area under the curve = 1
Probabilities are found by calculating areas under specific regions.
📐 Example — Probability of Extreme Height
Using the same population:
- Mean μ = 175 cm
- Standard deviation σ = 10 cm
Question: What is the probability that a randomly selected person is taller than 190 cm?
🔄 Standardization (Z-Score)
To compute probabilities, values are converted to a standard scale called the Z-score.
\[ Z = \frac{X - \mu}{\sigma} \]
Meaning
- X = observed value
- μ = population mean
- σ = standard deviation
- Z = number of standard deviations from mean
🧮 Applying Z-Score to Example
Height = 190 cm
Distance from mean = 190 − 175 = 15 cm
Standard deviation = 10 cm
\[ Z = \frac{15}{10} = 1.5 \]
📊 Finding Probability Using Z-Table
From standard normal tables:
P(Z > 1.5) ≈ 0.067
Interpretation:
- About 6.7% of people are taller than 190 cm
- If 10,000 people are sampled, about 670 would exceed 190 cm
🔁 Why Standardization Works
Standardizing is similar to converting units.
Changing units does not change the shape of the distribution.
- Centimeters → Inches
- Marks → Percentages
- Height → Z-scores
📘 Standard Normal Distribution
A special normal distribution where:
- Mean μ = 0
- Standard deviation σ = 1
It simplifies probability calculations using tables or software.
🌍 Real-Life Applications
📘 Education
- Exam score analysis
- Grading using percentiles
🏥 Medicine
- Blood pressure ranges
- Growth charts
🏭 Manufacturing
- Quality control
- Measurement errors
💹 Finance
- Stock return modeling
- Risk assessment
🤖 Artificial Intelligence
- Error distribution in models
- Feature normalization
- Gaussian probability models
- Neural network weight initialization
🧠 Key Insights
- Normal distribution is symmetric and bell-shaped
- Defined by mean and standard deviation
- Empirical rule gives quick probability estimates
- Probabilities equal areas under curve
- Z-scores standardize values for comparison
- Central to probability, inference, and AI modeling


