📊 Standard Deviation — Formula and Applications
As we move toward advanced statistics, it becomes important to describe data not only intuitively but also mathematically.
Standard Deviation is a fundamental statistical measure that quantifies how much data values typically vary from the mean.
It is widely used in data science, machine learning, finance, scientific research, and AI modeling.
🎯 Purpose of Standard Deviation
Standard deviation answers the question:
"On average, how far are data points from the mean?"
- Small SD → Data is consistent and tightly clustered
- Large SD → Data is highly variable and widely spread
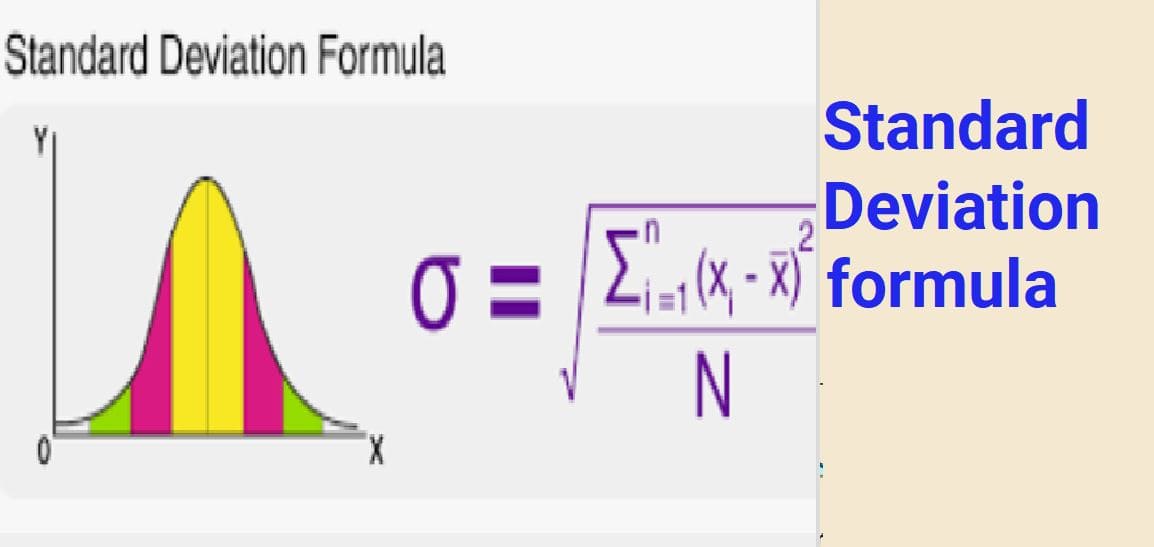
📐 Sample Standard Deviation Formula
\[ S = \sqrt{\frac{\sum_{i=1}^{n}(X_i - \bar{X})^2}{n-1}} \]
📘 Meaning of Symbols
| Symbol | Meaning |
|---|---|
| Xi | Individual data value |
| Ȳ (X̄) | Mean (average) of all values |
| Xi − X̄ | Deviation from the mean |
| (Xi − X̄)² | Squared deviation |
| Σ | Sum of all values |
| n | Number of observations |
| n − 1 | Degrees of freedom (sample correction) |
| √ | Square root (returns original units) |
🧠 Conceptual Meaning Behind the Formula
The formula follows five logical steps:
- Find the mean
- Find deviations from the mean
- Square deviations (to remove negatives)
- Find average of squared deviations → Variance
- Take square root → Standard Deviation
Standard deviation is the square root of the average squared deviation from the mean.
🧮 Worked Example
Dataset: 70, 75, 80, 85, 90
Step 1 — Mean
Mean = (70 + 75 + 80 + 85 + 90) ÷ 5 = 80
Step 2 — Deviations
| Value | Deviation | Squared Deviation |
|---|---|---|
| 70 | -10 | 100 |
| 75 | -5 | 25 |
| 80 | 0 | 0 |
| 85 | 5 | 25 |
| 90 | 10 | 100 |
Step 3 — Variance
Variance = (100 + 25 + 0 + 25 + 100) ÷ (5 − 1) = 250 ÷ 4 = 62.5
Step 4 — Standard Deviation
SD = √62.5 ≈ 7.91
Interpretation: Scores typically vary about 8 marks from the average.
📊 Population vs Sample Standard Deviation
| Population SD | Sample SD |
|---|---|
| \(\sigma = \sqrt{\frac{\sum (X_i - \mu)^2}{n}}\) | \(S = \sqrt{\frac{\sum (X_i - \bar{X})^2}{n-1}}\) |
| Used when entire population is studied | Used when only a sample is studied |
🌍 Applications of Standard Deviation
📘 Education
- Measures consistency of student performance
- Low SD → similar performance
- High SD → performance gap
💹 Finance
- Measures investment risk
- High SD → high volatility
- Low SD → stable returns
🏭 Quality Control
- Measures variation in product quality
- Low SD ensures uniform manufacturing
🌦️ Climate Science
- Measures temperature variability
🤖 Artificial Intelligence & Machine Learning
- Feature scaling and normalization
- Z-score standardization
- Understanding model error spread
- Bias-variance tradeoff
📈 Interpreting Standard Deviation Visually
In a normal distribution:
- 68% of values lie within ±1 SD
- 95% lie within ±2 SD
- 99.7% lie within ±3 SD
This is called the Empirical Rule and is fundamental in AI error modeling.
🧠 Key Insights
- Standard deviation measures variability
- It is rooted in variance
- Uses squared deviations to avoid cancellation
- Square root restores original units
- Essential for advanced statistics and AI
Standard deviation is the bridge between descriptive statistics and predictive modeling.


