📘 Regression Model Evaluation Metrics
After building a regression model, we must determine whether the model makes accurate predictions. Model evaluation metrics quantify prediction errors and help compare different models.
🎯 Why Model Evaluation is Important
A regression model may appear to fit the data well, but without proper evaluation we cannot know how reliable its predictions are.
Model evaluation helps us:
- Measure prediction accuracy
- Compare different models
- Detect poor model performance
- Improve predictive models
- Prepare models for real-world applications
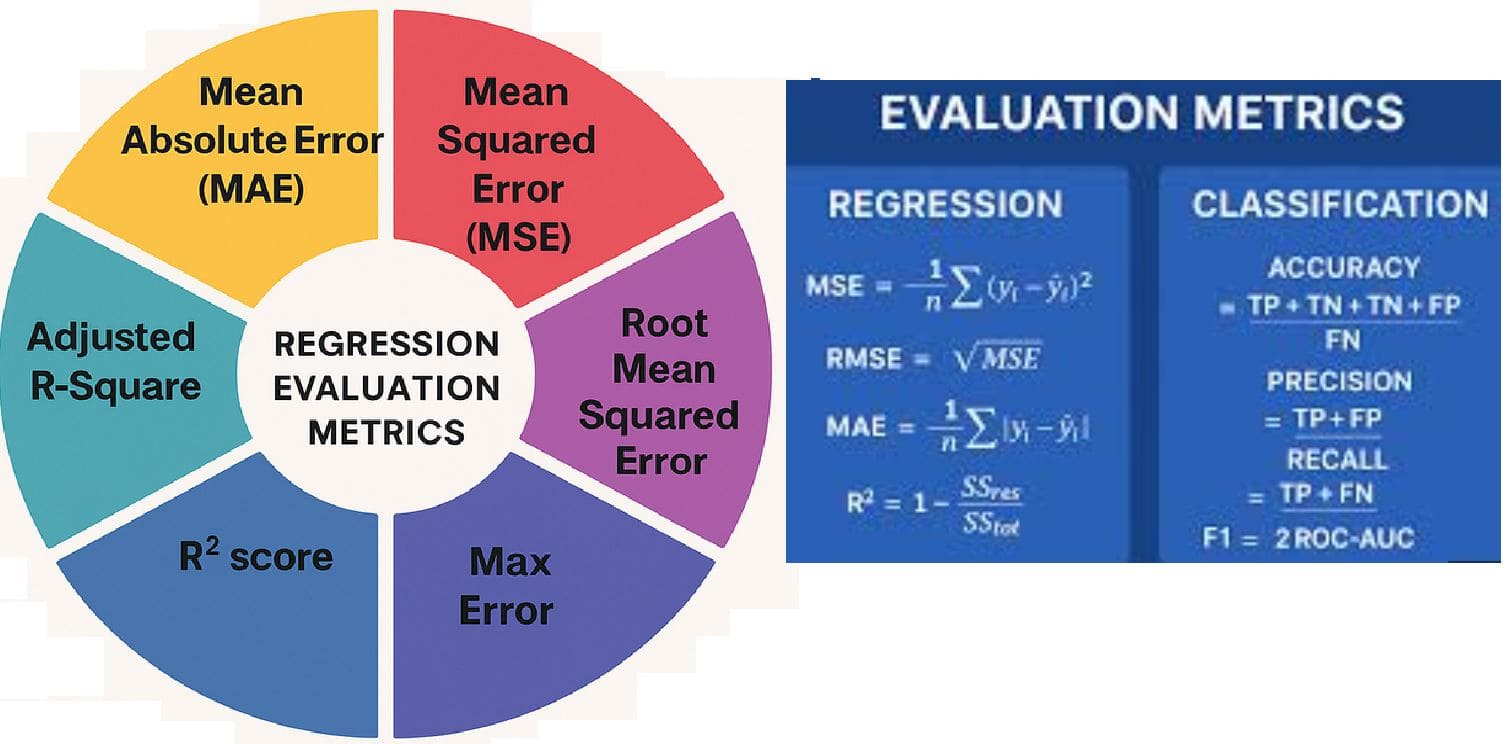
📊 Common Regression Evaluation Metrics
Several metrics are commonly used to evaluate regression models:
- Mean Absolute Error (MAE)
- Mean Squared Error (MSE)
- Root Mean Squared Error (RMSE)
- Coefficient of Determination (R²)
📐 Mean Absolute Error (MAE)
Mean Absolute Error measures the average absolute difference between predicted values and actual values.
\[ MAE = \frac{1}{n} \sum |y_i - \hat{y}_i| \]
Interpretation:
- MAE represents the average prediction error.
- Lower MAE indicates better model performance.
Example:
If a model predicting house prices has an MAE of $10,000, it means predictions are on average $10,000 away from actual prices.
📐 Mean Squared Error (MSE)
Mean Squared Error measures the average squared difference between predicted and actual values.
\[ MSE = \frac{1}{n} \sum (y_i - \hat{y}_i)^2 \]
Squaring penalizes large errors more heavily.
📐 Root Mean Squared Error (RMSE)
Root Mean Squared Error is the square root of the mean squared error.
\[ RMSE = \sqrt{\frac{1}{n} \sum (y_i - \hat{y}_i)^2} \]
RMSE has the same units as the original variable, making it easier to interpret.
Example:
If RMSE = 5 in a model predicting exam scores, predictions are typically about 5 points away from actual scores.
📊 Coefficient of Determination (R²)
R² measures how much of the variation in the dependent variable is explained by the regression model.
\[ R^2 = 1 - \frac{SS_{res}}{SS_{tot}} \]
Where:
- SSres = residual sum of squares
- SStot = total sum of squares
| R² Value | Interpretation |
|---|---|
| 0 | Model explains none of the variability |
| 0.5 | Model explains 50% of variability |
| 1 | Perfect prediction |
📊 Example — Model Evaluation
| Actual Price | Predicted Price |
|---|---|
| 200 | 195 |
| 250 | 260 |
| 300 | 290 |
| 350 | 360 |
Using these values we can compute MAE, MSE, RMSE, and R² to determine how well the model predicts house prices.
🤖 Importance in Machine Learning
These evaluation metrics are widely used in machine learning models.
- Regression algorithms
- Neural networks
- Gradient boosting models
- Random forest regression
🧠 Key Insights
- Evaluation metrics measure prediction accuracy.
- MAE measures average absolute error.
- MSE penalizes large errors more strongly.
- RMSE expresses error in the same units as the data.
- R² measures the explanatory power of the model.
- These metrics are essential for machine learning model evaluation.


