📊 Percentiles, Quantiles, and Quartiles
When we analyze data, we often want to know how a value compares with the rest of the dataset.
They divide ordered data into equal parts so we can see how data is distributed.
🔢 Step 1: Arrange Data in Order
To find percentiles or quartiles, data must first be arranged from smallest to largest.
📌 Example Dataset (Exam Scores of 13 Students)
55, 60, 62, 65, 67, 70, 77, 82, 85, 88, 90, 92, 95
This ordered list makes it easier to find positions of values.
📍 What Are Percentiles?
A percentile tells us the value below which a certain percentage of observations fall.
⭐ Most Important Percentile
50th Percentile → Median
- Divides data into two equal halves
- 50% of values are below it
- 50% of values are above it
Example:
Median score = 77
There are 6 scores below 77 and 6 scores above 77.
📦 What Are Quartiles?
Quartiles are special percentiles that divide data into four equal parts.
🔹 First Quartile (Q1)
- Also called the 25th percentile
- 25% of data lies below it
- 75% lies above it
Example:
Q1 ≈ 65
🔹 Second Quartile (Q2)
- Also called the 50th percentile
- This is the Median
Q2 = 77
🔹 Third Quartile (Q3)
- Also called the 75th percentile
- 75% of data lies below it
- 25% lies above it
Example:
Q3 ≈ 90
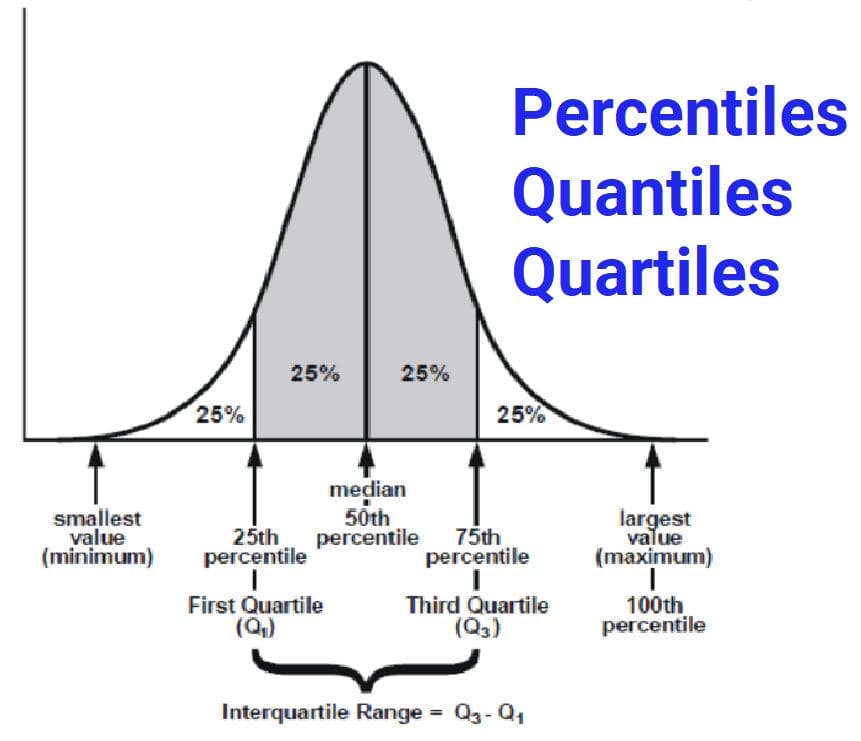
📐 Visual Meaning of Quartiles
Quartiles divide data like this:
- Lowest 25% → Below Q1
- Middle 25% → Between Q1 and Median
- Next 25% → Between Median and Q3
- Highest 25% → Above Q3
🔍 What Are Quantiles?
A quantile is a general term for values that divide data into equal-sized groups.
Examples of Quantiles
| Type | Divides Data Into |
|---|---|
| Quartiles | 4 equal parts |
| Quintiles | 5 equal parts |
| Deciles | 10 equal parts |
| Percentiles | 100 equal parts |
🎯 Understanding Percentiles with Real-Life Meaning
📌 Example 1: Test Performance
A student is at the 80th percentile.
📌 Example 2: Baby Growth Charts
A baby in the 60th percentile for height is taller than 60% of babies the same age.
📌 Example 3: Income Statistics
If your income is at the 90th percentile, you earn more than 90% of people.
🔄 Percentiles Work in Two Ways
1️⃣ Finding the Value at a Given Percentile
“What score is at the 75th percentile?”
2️⃣ Finding the Percentile of a Given Value
“What percentile is a score of 82?”
If 82 is greater than most scores, it may lie near the 80th percentile.
📊 Why Are Percentiles and Quartiles Useful?
- ✔️ Compare performance across groups
- ✔️ Understand relative position in data
- ✔️ Identify top or bottom performers
- ✔️ Summarize large datasets
- ✔️ Used in education, medicine, economics
🌍 Real-Life Applications
- 🏫 School ranking systems
- 🏥 Medical growth charts
- 💼 Salary comparisons
- 🏃 Athlete performance analysis
- 📈 Business data reports
⚠️ Important Notes
- Data must be arranged in order
- Software usually calculates percentiles
- Different methods may give slightly different values
- Focus on understanding meaning rather than calculation
🧠 Key Takeaways
- Percentiles show relative position in data
- Median is the 50th percentile
- Quartiles divide data into four equal parts
- Quantiles are general divisions of ordered data
- They help interpret data meaningfully


