📘 p-value & Statistical Significance
It quantifies how likely it is to observe the data (or more extreme values) if the null hypothesis is true. A small p-value indicates strong evidence against the null hypothesis.
🎯 What is the p-value?
The p-value is the probability of obtaining a result equal to or more extreme than the one observed, assuming the null hypothesis is true.
It represents the strength of evidence in favor of rejecting the null hypothesis. A low p-value suggests that the observed data is inconsistent with H₀.
⚖️ Statistical Significance
Statistical significance tells us whether the observed effect is likely due to chance or if it is meaningful enough to reject the null hypothesis.
If the p-value is smaller than a pre-specified threshold (called the **significance level** α), we reject H₀. If not, we fail to reject H₀.
📊 Interpretation of p-value
The p-value provides the probability of obtaining a test statistic at least as extreme as the one calculated, assuming the null hypothesis is true.
Example Interpretation:
- p-value = 0.03 → There is a 3% chance of observing the data (or more extreme) if H₀ is true.
- p-value = 0.10 → There is a 10% chance of observing the data (or more extreme) if H₀ is true.
The lower the p-value, the less likely the observed effect occurred due to random variation.
🎯 Significance Level (α)
The significance level, denoted as α, is the threshold below which we reject H₀.
Common values for α are:
- α = 0.05 → 5% risk of rejecting a true null hypothesis
- α = 0.01 → 1% risk of rejecting a true null hypothesis
We usually choose α before conducting the test, ensuring consistency across studies.
🔍 Example — Hypothesis Testing with p-value
Claim: A new drug reduces recovery time by at least 2 days compared to the current drug. The average recovery time for the current drug is 10 days.
Null Hypothesis: H₀: No difference (i.e., new drug recovery time = 10 days)
Alternative Hypothesis: H₁: New drug reduces recovery time (i.e., recovery time < 10 days)
Given: Sample mean = 8 days, Standard deviation = 1.5 days, n = 50, significance level α = 0.05.
Step 1: Calculate the test statistic
\[ Z = \frac{\bar{x} - \mu_0}{\sigma / \sqrt{n}} = \frac{8 - 10}{1.5 / \sqrt{50}} = \frac{-2}{0.2121} \approx -9.43 \]
Step 2: Find the p-value
Since this is a one-tailed test, we look up the p-value for Z = -9.43 in a Z-table or use statistical software:
p-value ≈ 0
Step 3: Compare with α
Since the p-value (0) is much smaller than the significance level α (0.05), we reject the null hypothesis.
Conclusion: There is strong evidence that the new drug reduces recovery time.
📊 p-value and Hypothesis Testing Summary
| p-value | Action | Decision |
|---|---|---|
| p < α | Reject H₀ | There is sufficient evidence to support the alternative hypothesis |
| p ≥ α | Fail to reject H₀ | There is insufficient evidence to support the alternative hypothesis |
🔄 p-value and Type I Error
The p-value is directly related to the probability of making a Type I error:
- Small p-value → Low probability of Type I error → Strong evidence against H₀
- Large p-value → High probability of Type I error → Weak evidence against H₀
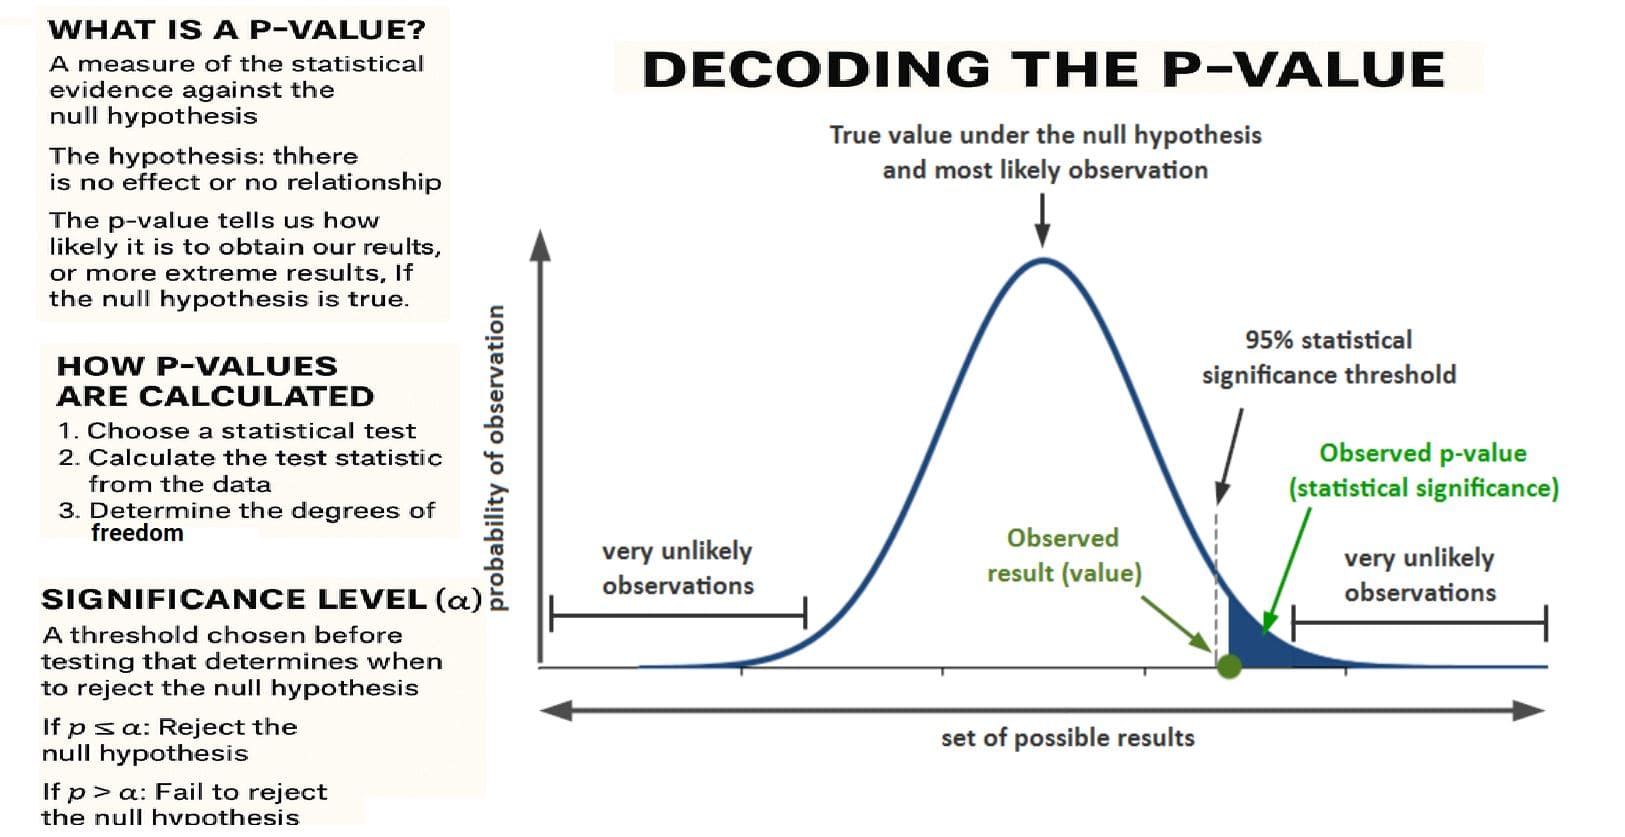
📈 Visualizing p-value
A common way to visualize p-value is through the probability curve:
- The area under the curve from the test statistic to the tail represents the p-value.
- A smaller p-value corresponds to a larger area in the tail, indicating greater evidence against H₀.
🤖 p-value in Machine Learning
- Evaluating model significance in experiments
- Determining feature importance in regression
- Comparing model performance (e.g., A/B testing)
- Validating hypotheses about performance improvements
🧠 Key Insights
- p-value quantifies evidence against H₀
- Smaller p-value → stronger evidence against H₀
- p-value helps decide whether to reject H₀
- Statistical significance is determined by comparing p-value with α
- p-value interpretation depends on context and test type


