📘 Non-Parametric Tests: Introduction & Applications
These tests are often used when dealing with ordinal data, non-normally distributed data, or small sample sizes.
🎯 What are Non-Parametric Tests?
Non-parametric tests are statistical tests that do not rely on assumptions about the parameters of the population distribution, unlike parametric tests (such as the t-test or ANOVA) that assume normality and other conditions.
They are also known as distribution-free tests because they do not assume any specific distribution of the data.
Common uses of non-parametric tests:
- When the data is ordinal (ranks, categories).
- When the data is not normally distributed.
- When sample sizes are small.
- When dealing with skewed distributions or outliers.
⚖️ Key Features of Non-Parametric Tests
- No assumption about data distribution (non-normality is acceptable).
- Suitable for ordinal data or non-numeric scales.
- More flexible in handling small or skewed datasets.
- Not as powerful as parametric tests when the assumptions of parametric tests are met.
Non-parametric tests are often the go-to choice when the data does not meet the requirements of parametric methods.
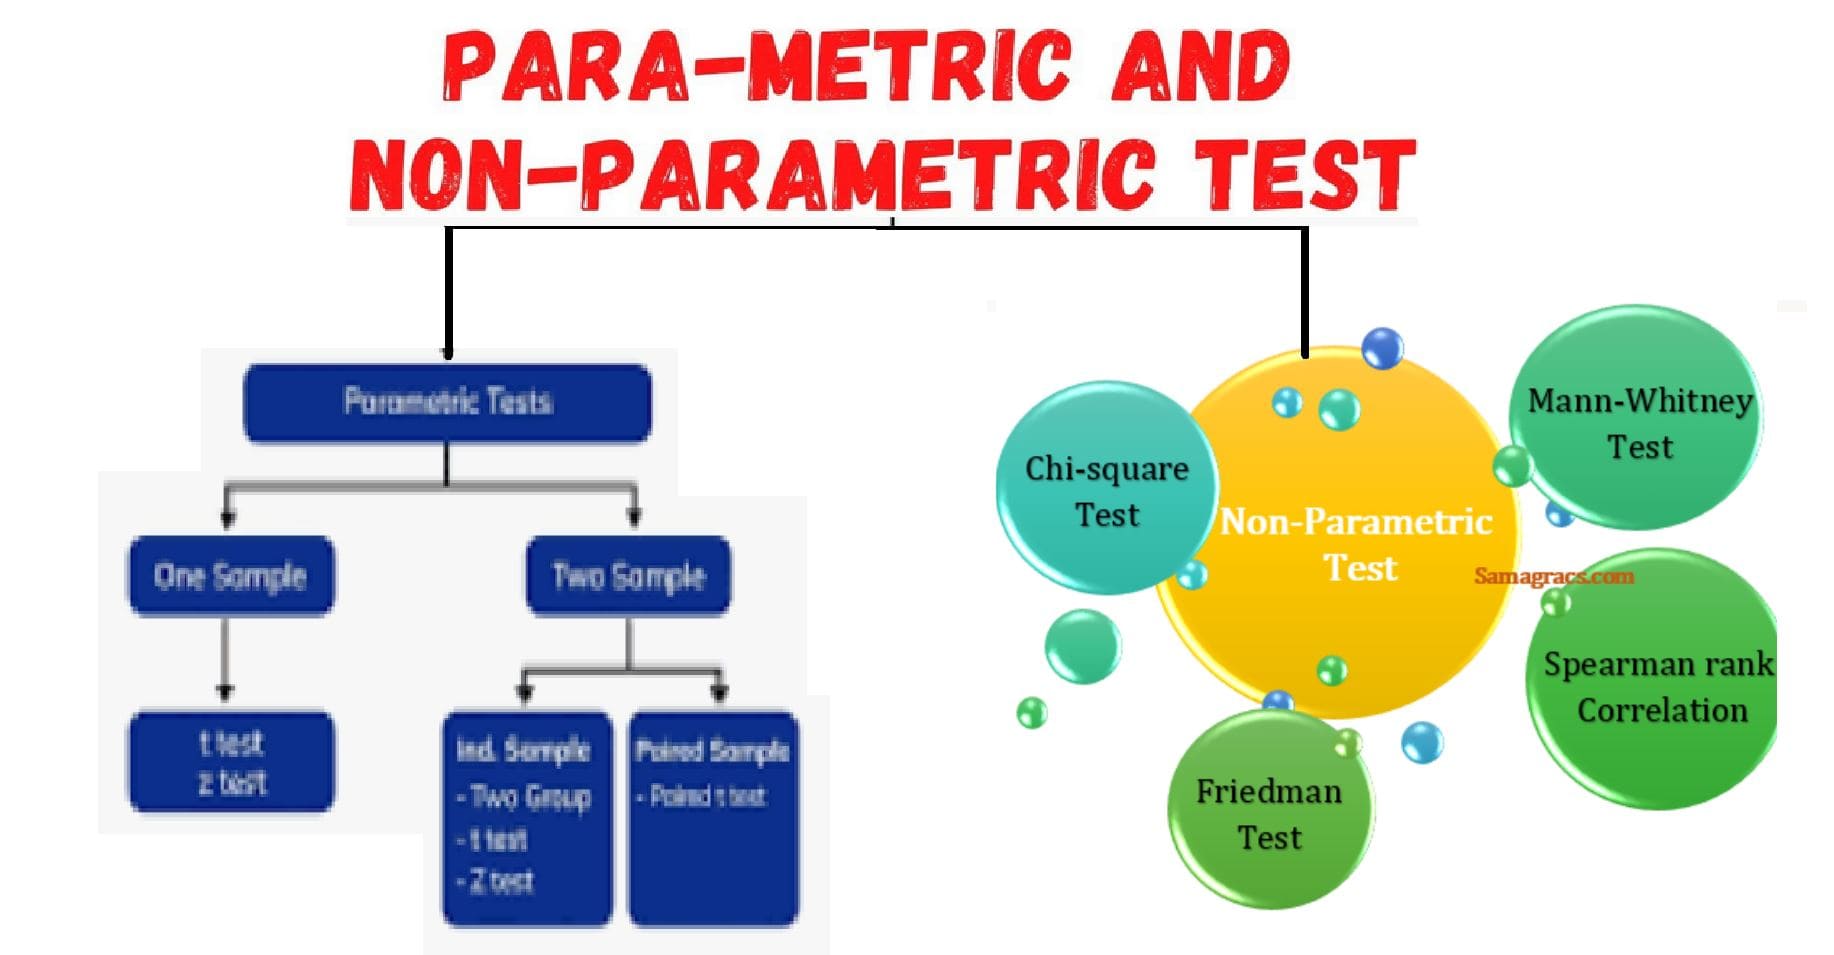
📊 Common Non-Parametric Tests
- Chi-Square Test: Used for categorical data, to determine if there is an association between two variables (covered previously in our course).
- Mann-Whitney U Test: Used to compare two independent groups when the dependent variable is ordinal or not normally distributed.
- Wilcoxon Signed-Rank Test: Used to compare two related samples when the dependent variable is ordinal or not normally distributed (paired test).
- Kruskal-Wallis H Test: Used to compare more than two independent groups, similar to one-way ANOVA, when assumptions for ANOVA are not met.
- Spearman's Rank Correlation: Used to measure the strength and direction of association between two ranked variables.
🔹 Mann-Whitney U Test
The Mann-Whitney U test is used to compare two independent groups when the dependent variable is ordinal or not normally distributed.
Example: Testing whether men and women have different levels of job satisfaction. If satisfaction scores are ordinal (e.g., low, medium, high), the Mann-Whitney U test can be used.
Test Logic:
- Ranks all data from both groups together.
- Calculates a U statistic based on the ranks.
- Compares the U statistic to the distribution to find the p-value.
Null Hypothesis (H₀): The distributions of both groups are the same.
Alternative Hypothesis (H₁): The distributions of both groups are different.
🔹 Wilcoxon Signed-Rank Test
The Wilcoxon Signed-Rank test is used to compare two related or paired samples when the data is ordinal or not normally distributed.
Example: Comparing the pre- and post-treatment scores of patients on a scale where the differences are not normally distributed.
Test Logic:
- For each pair of values, calculate the difference.
- Rank the absolute values of the differences.
- Sum the ranks for positive and negative differences separately.
- Calculate the test statistic and compare it to the critical value.
Null Hypothesis (H₀): There is no difference between the two related samples.
Alternative Hypothesis (H₁): There is a significant difference between the two related samples.
🔹 Kruskal-Wallis H Test
The Kruskal-Wallis H test is used to compare more than two independent groups, particularly when the assumptions for ANOVA are not met (e.g., non-normal distribution).
Example: Comparing the satisfaction levels of customers across three different stores where the satisfaction scores are ordinal.
Test Logic:
- Ranks all data across all groups.
- Calculates the H statistic based on the ranks and the sample sizes.
- Compares the H statistic to the Chi-Square distribution to find the p-value.
Null Hypothesis (H₀): All group distributions are the same.
Alternative Hypothesis (H₁): At least one group distribution differs significantly.
🔹 Spearman's Rank Correlation
Spearman's Rank Correlation is used to measure the strength and direction of the relationship between two ranked variables.
Example: Testing if there is a relationship between employee satisfaction and performance ranking.
Test Logic:
- Ranks the values of both variables.
- Calculates the difference in ranks for each pair of values.
- Calculates the correlation coefficient (ρ), which ranges from -1 to 1.
- ρ > 0 indicates a positive correlation, ρ < 0 indicates a negative correlation, and ρ = 0 indicates no correlation.
Null Hypothesis (H₀): There is no relationship between the two ranked variables.
Alternative Hypothesis (H₁): There is a significant relationship between the two ranked variables.
📊 Non-Parametric vs Parametric Tests
| Test Type | When to Use | Example | Assumptions |
|---|---|---|---|
| Parametric Tests | When data is normally distributed and variances are known/assumed equal | t-test, ANOVA | Normal distribution, equal variance |
| Non-Parametric Tests | When data is not normally distributed, ordinal, or small sample size | Mann-Whitney U test, Wilcoxon signed-rank test | No assumption about the population distribution |
🧠 Key Insights
- Non-parametric tests do not assume normality and are used for ordinal or non-normally distributed data.
- Common non-parametric tests include the Mann-Whitney U test, Wilcoxon signed-rank test, and Kruskal-Wallis H test.
- Non-parametric tests are useful for small sample sizes or data with outliers.
- Although non-parametric tests are more flexible, they may be less powerful than parametric tests when the assumptions for the latter are met.


