📘 Confidence Intervals — Introduction to Estimation
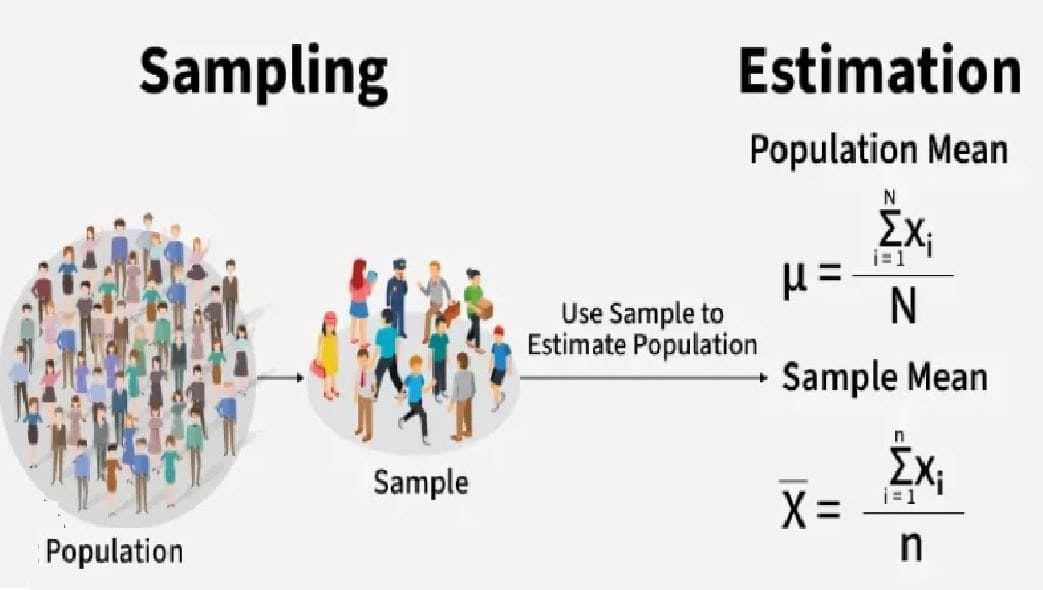
In real-world situations, studying an entire population is often impossible due to time, cost, or practical limitations. Therefore, we collect data from a smaller group (sample) and use it to estimate characteristics of the whole population.
🎯 Why Estimation is Necessary
- Populations can be extremely large
- Collecting complete data may be expensive
- Some measurements are destructive (e.g., testing product strength)
- Decisions often need to be made quickly
👥 Population Parameters vs Sample Statistics
| Concept | Population | Sample |
|---|---|---|
| Mean | μ (Mu) | x̄ (Sample Mean) |
| Standard Deviation | σ (Sigma) | s (Sample SD) |
| Proportion | p | p̂ |
📌 Types of Estimation
1️⃣ Point Estimation
A point estimate provides a single best value to estimate a population parameter.
Examples:
- Using sample mean to estimate population mean
- Using sample proportion to estimate population proportion
Example:
A survey of 100 students shows average study time = 4 hours.
2️⃣ Interval Estimation
An interval estimate provides a range of values within which the population parameter is likely to lie.
Example:
This range accounts for sampling variability and is more reliable than a single point.
⚠️ Why Point Estimates Are Not Enough
Different samples produce different point estimates.
If we repeatedly sample the population, each sample mean will vary.
Illustration:
- Sample 1 mean = 68
- Sample 2 mean = 72
- Sample 3 mean = 70
Which value is correct? All are possible due to sampling variability.
📏 Sampling Variability
Sampling variability refers to natural differences that occur between sample statistics.
This variability is explained by the Sampling Distribution and Central Limit Theorem studied earlier.
🎯 Motivation for Confidence Intervals
Since point estimates vary, we need a method that:
- Accounts for variability
- Provides a range of plausible values
- Indicates estimation reliability
🧮 Example: Estimating Average Height
Suppose we measure the heights of 50 students and find:
- Sample mean height = 170 cm
This value is a point estimate of the population mean.
However, another sample may produce 168 cm or 172 cm.
🧠 Key Insights
- Estimation uses samples to learn about populations
- Population parameters are unknown but fixed
- Sample statistics vary from sample to sample
- Point estimates provide single values
- Interval estimates provide ranges
- Interval estimates are more reliable
🤖 Why Estimation Matters in Machine Learning
- Estimating true model accuracy
- Estimating population error rates
- Parameter tuning
- Performance reliability measurement


