📘 Confidence Interval for Population Proportion
This method is widely used in surveys, opinion polls, quality testing, and classification accuracy measurement.
🎯 Objective
To estimate the true population proportion (p) using the sample proportion (p̂).
👥 Understanding Proportion
A proportion represents a fraction of the population with a specific attribute.
Examples:
- Proportion of voters supporting a candidate
- Proportion of defective products
- Proportion of patients responding to treatment
- Classification accuracy in ML models
📐 Sample Proportion
Sample proportion is calculated as:
\[ \hat{p} = \frac{x}{n} \]
- x = number of successes
- n = total sample size
📊 Standard Error of Proportion
The variability of the sample proportion is measured by:
\[ SE = \sqrt{\frac{\hat{p}(1 - \hat{p})}{n}} \]
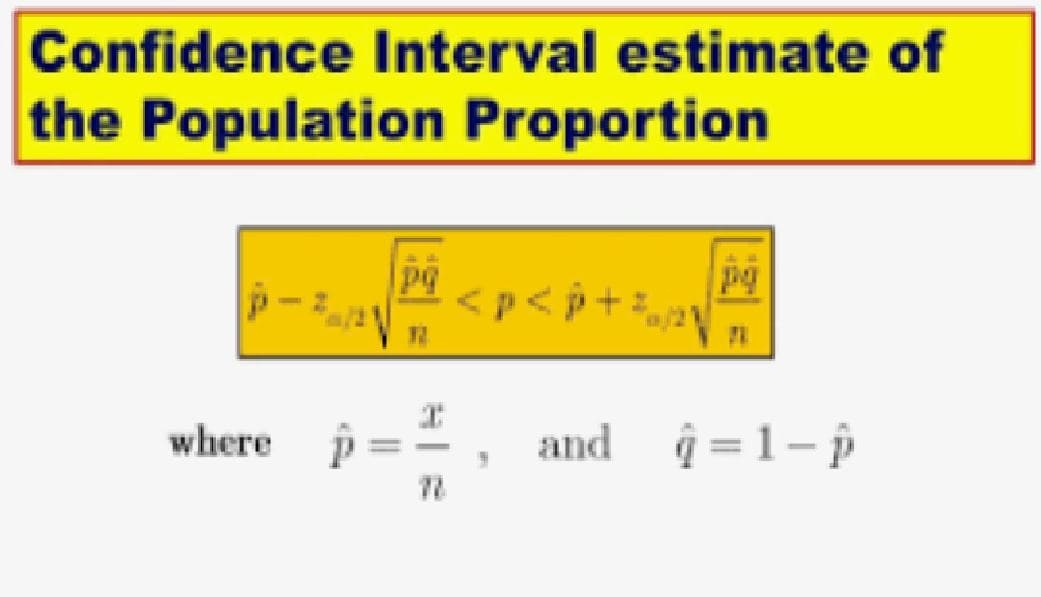
📏 Formula for Confidence Interval
\[ \hat{p} \pm Z_{\alpha/2} \cdot \sqrt{\frac{\hat{p}(1 - \hat{p})}{n}} \]
Where:
- p̂ = Sample proportion
- Z = Z-score from normal distribution
- n = Sample size
📋 Conditions for Use
- Random sampling
- Independent observations
- Sample size sufficiently large
- np̂ ≥ 5 and n(1−p̂) ≥ 5
🔢 Example 1: Estimating Voter Support
Given:
- In a survey of 500 voters, 320 support a candidate
- Confidence level = 95%
Step 1: Sample Proportion
\[ \hat{p} = \frac{320}{500} = 0.64 \]
Step 2: Standard Error
\[ SE = \sqrt{\frac{0.64(1-0.64)}{500}} = \sqrt{\frac{0.2304}{500}} = \sqrt{0.0004608} \approx 0.0215 \]
Step 3: Z-value
For 95% confidence → Z = 1.96
Step 4: Margin of Error
\[ ME = 1.96 \times 0.0215 \approx 0.042 \]
Step 5: Construct Interval
0.64 ± 0.042
In percentage form: (59.8% , 68.2%)
📊 Interpretation
⚖️ Factors Affecting Interval Width
1️⃣ Sample Size
- Larger sample → Narrower interval
- Smaller sample → Wider interval
2️⃣ Confidence Level
- Higher confidence → Wider interval
- Lower confidence → Narrower interval
3️⃣ Proportion Value
- Maximum variability occurs near p = 0.5
📈 Practical Applications
- Political opinion polls
- Market research surveys
- Public health statistics
- Quality control testing
- Social science research
🤖 Applications in Machine Learning
- Estimating classification accuracy
- Evaluating precision and recall rates
- Measuring model success probabilities
- Binary prediction reliability
🧠 Key Insights
- Used for binary outcomes (Yes/No, Success/Failure)
- Sample proportion estimates population proportion
- Z-distribution used for interval construction
- Interval width depends on sample size and confidence level
- Widely used in surveys and ML evaluation


