📘 Confidence Intervals — Concept & Interpretation
Instead of giving a single estimate, confidence intervals provide a range that accounts for sampling uncertainty.
🎯 Why Confidence Intervals Are Needed
Point estimates vary from sample to sample due to natural randomness.
Therefore, a single estimate cannot fully represent the true population value.
📦 Components of a Confidence Interval
A confidence interval consists of three important parts:
1️⃣ Point Estimate
The best single estimate obtained from sample data.
Examples: sample mean (x̄), sample proportion (p̂)
2️⃣ Margin of Error (ME)
The amount added and subtracted from the point estimate to create a range.
3️⃣ Confidence Level
The probability that the interval estimation method captures the true population parameter.
📐 General Form of Confidence Interval
Confidence Interval = Point Estimate ± Margin of Error
\[ \text{CI} = \text{Estimate} \pm \text{ME} \]
This creates a lower limit and an upper limit.
🔢 Example: Estimating Average Exam Score
Suppose a sample of students gives:
- Sample mean = 72 marks
- Margin of error = 3 marks
Confidence interval:
72 ± 3
We estimate that the population mean lies between 69 and 75.
🎚️ Understanding Confidence Level
Common confidence levels are:
- 90% Confidence Level
- 95% Confidence Level
- 99% Confidence Level
📊 Interpretation Example
A 95% confidence interval for mean height is (168 cm, 172 cm).
Correct Interpretation:
Incorrect Interpretation:
- The population mean has a 95% probability of being in the interval ❌
- 95% of individual heights lie in the interval ❌
⚖️ Factors Affecting Confidence Interval Width
1️⃣ Sample Size (n)
- Larger samples → Narrower intervals
- Smaller samples → Wider intervals
2️⃣ Variability (σ)
- Higher variability → Wider intervals
- Lower variability → Narrower intervals
3️⃣ Confidence Level
- Higher confidence → Wider interval
- Lower confidence → Narrower interval
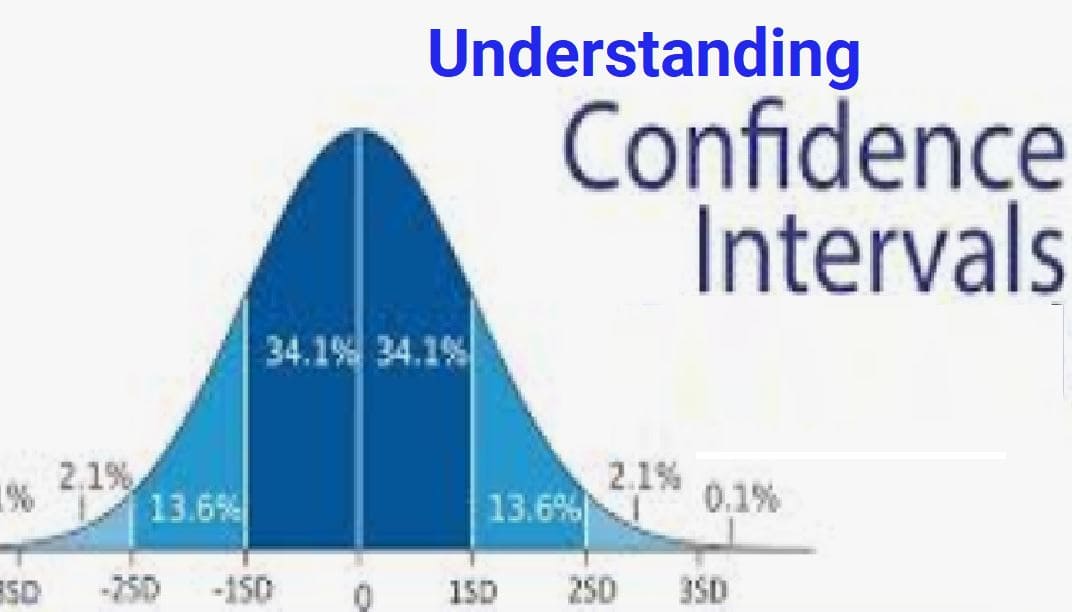
📈 Visual Intuition
Imagine repeatedly sampling and computing intervals:
- Most intervals contain the true value
- A few miss due to randomness
Confidence level measures the success rate of this method.
🧠 Why Confidence Intervals Are Better Than Point Estimates
| Point Estimate | Confidence Interval |
|---|---|
| Single value | Range of plausible values |
| No uncertainty measure | Shows reliability |
| Less informative | More informative |
🤖 Importance in Machine Learning
- Evaluating model accuracy ranges
- Estimating error margins
- Comparing model performances
- Reliability of predictions
🧠 Key Insights
- Confidence intervals provide ranges, not exact values
- They combine estimation and uncertainty
- Higher confidence produces wider intervals
- Larger samples produce more precise estimates
- They form the basis for statistical decision-making


