📘 Chi-Square Test for Independence
This test compares the observed frequencies in each category to the expected frequencies if the variables were independent.
🎯 What is the Chi-Square Test for Independence?
The Chi-Square test for independence tests whether two categorical variables are related or independent. It is based on the idea that if the variables are independent, the distribution of one variable should not depend on the other.
This test is commonly used in fields such as market research, healthcare, and social science to understand relationships between categorical variables.
Null Hypothesis (H₀): The two categorical variables are independent.
Alternative Hypothesis (H₁): The two categorical variables are dependent (associated).
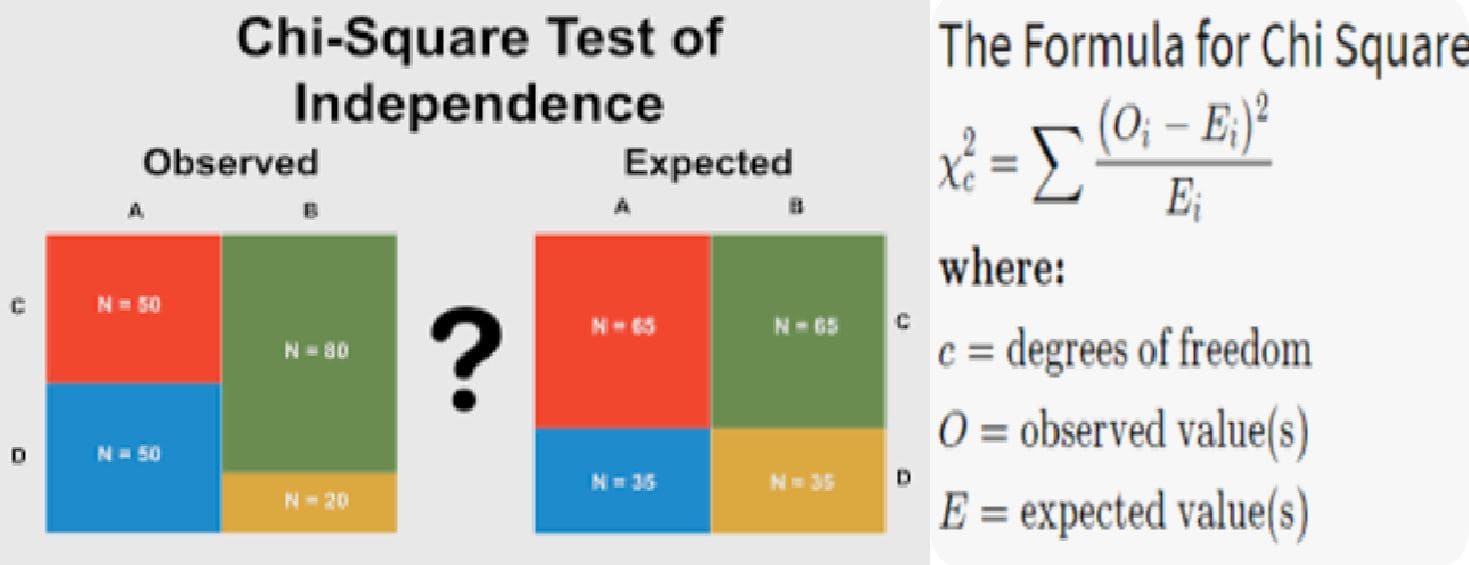
⚖️ The Chi-Square Test Statistic
The test statistic for the Chi-Square test is calculated as:
\[ \chi^2 = \sum \frac{(O - E)^2}{E} \]
Where:
- \(O\) = Observed frequency (what we actually observed in the data)
- \(E\) = Expected frequency (what we would expect if the variables were independent)
- \(\sum\) = Sum over all categories in the contingency table
The Chi-Square statistic follows a Chi-Square distribution with degrees of freedom determined by the number of categories in the two variables.
📊 Expected Frequency Calculation
The expected frequency for each cell in the contingency table is calculated by multiplying the row total by the column total and dividing by the grand total:
\[ E = \frac{(Row Total) \times (Column Total)}{Grand Total} \]
Steps:
- Step 1: Create a contingency table with the observed frequencies (O).
- Step 2: Calculate the expected frequencies (E) for each cell in the table.
- Step 3: Compute the Chi-Square statistic using the formula.
- Step 4: Determine the degrees of freedom (df) for the Chi-Square distribution.
- Step 5: Compare the Chi-Square statistic with the critical value from the Chi-Square distribution table.
🔍 Example — Chi-Square Test for Independence
Research Question: Is there an association between gender and preference for a particular brand of soda (A, B, or C)?
Data:
| Gender / Brand | Brand A | Brand B | Brand C | Total |
|---|---|---|---|---|
| Male | 30 | 10 | 20 | 60 |
| Female | 40 | 20 | 30 | 90 |
| Total | 70 | 30 | 50 | 150 |
Step 1: Calculate Expected Frequencies
Formula:
\[ E = \frac{(Row Total) \times (Column Total)}{Grand Total} \]Example Calculation for Brand A, Male:
\[ E = \frac{60 \times 70}{150} = 28 \]Repeat this calculation for all cells in the table:
| Gender / Brand | Brand A (E) | Brand B (E) | Brand C (E) | Total |
|---|---|---|---|---|
| Male | 28 | 12 | 20 | 60 |
| Female | 42 | 18 | 30 | 90 |
| Total | 70 | 30 | 50 | 150 |
Step 2: Calculate the Chi-Square Statistic
\[ \chi^2 = \sum \frac{(O - E)^2}{E} \] For each cell, calculate the difference between observed (O) and expected (E), square it, divide by E, and sum over all cells. \[ \chi^2 = \frac{(30 - 28)^2}{28} + \frac{(10 - 12)^2}{12} + \frac{(20 - 20)^2}{20} + \frac{(40 - 42)^2}{42} + \frac{(20 - 18)^2}{18} + \frac{(30 - 30)^2}{30} \] \[ \chi^2 = \frac{4}{28} + \frac{4}{12} + 0 + \frac{4}{42} + \frac{4}{18} + 0 \] \[ \chi^2 = 0.143 + 0.333 + 0 + 0.095 + 0.222 + 0 = 0.793 \]Step 3: Degrees of Freedom
\[ df = (Rows - 1) \times (Columns - 1) = (2 - 1) \times (3 - 1) = 1 \times 2 = 2 \]Step 4: Compare with Critical Value
From the Chi-Square distribution table, for df = 2 and α = 0.05, the critical value is 5.991. Since \(\chi^2 = 0.793 < 5.991\), we fail to reject the null hypothesis.Conclusion: There is no significant association between gender and preference for soda brands at the 5% significance level.
📊 Key Takeaways
- The Chi-Square Test for Independence tests whether two categorical variables are related.
- It uses observed and expected frequencies to calculate the test statistic.
- We reject H₀ if the test statistic exceeds the critical value or if the p-value is smaller than α.
- The test is widely used in various fields such as market research, healthcare, and education to understand relationships between variables.
🧠 Real-World Applications
- Market Research: Determining if there's a relationship between customer demographics and product preferences.
- Medical Studies: Testing whether a particular treatment is effective across different groups (e.g., age or gender).
- Social Science: Understanding the relationship between social factors and behavior patterns.


